Staff Software Engineer at Apple

Javid
Hsueh.

Frontend engineering. Data visualization.
Thoughtful interfaces, curious exploration.

A little about me
A visual playgroundAn original generative illustration of connected ideas. Use the layout buttons below to explore connections, flow, and structure. This is decorative artwork, not research data.
Engineering × visualization × interactionPersonal notes & collected work

Work & explorations

Interactive systems, visual experiments, and research.

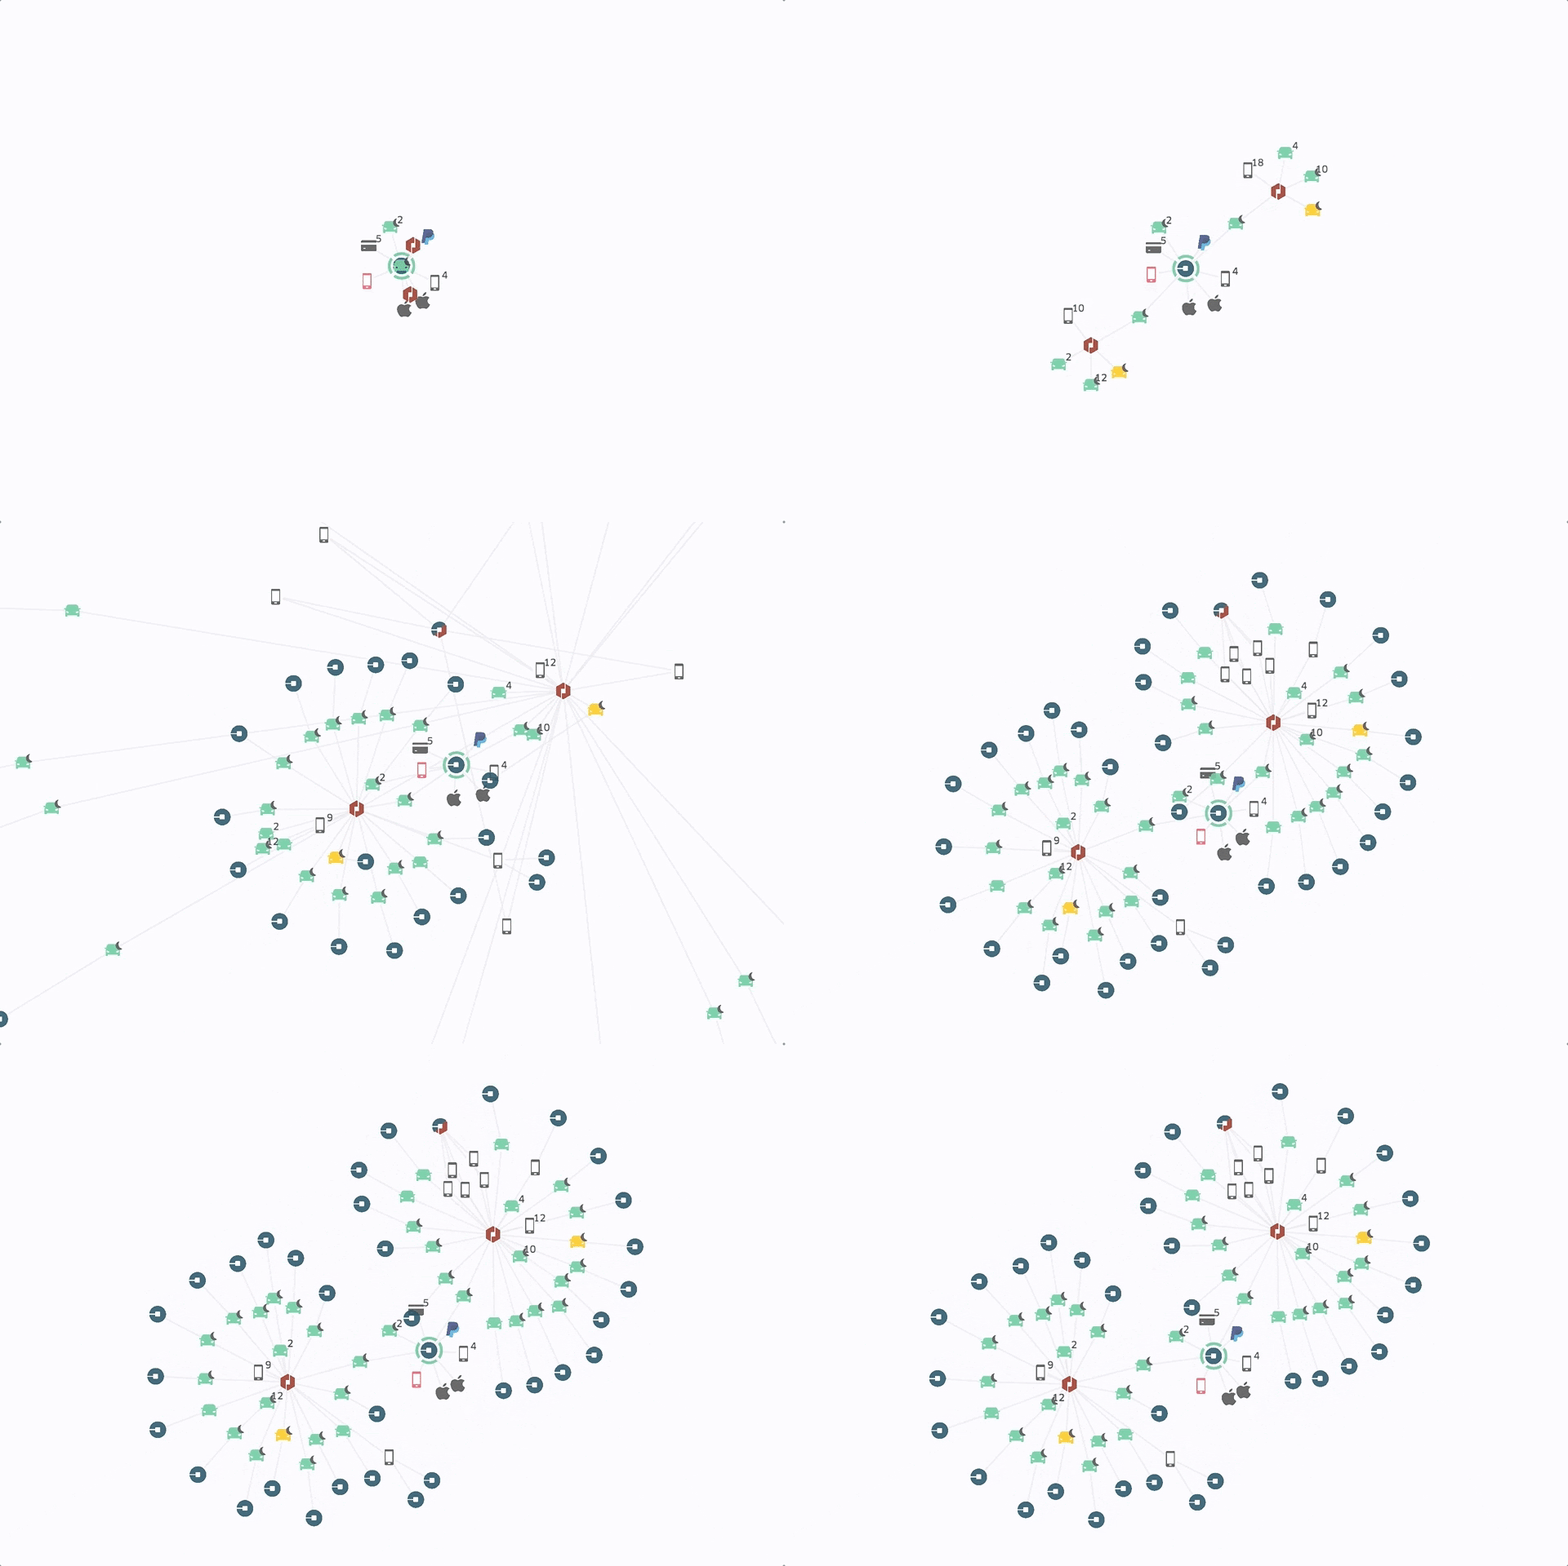
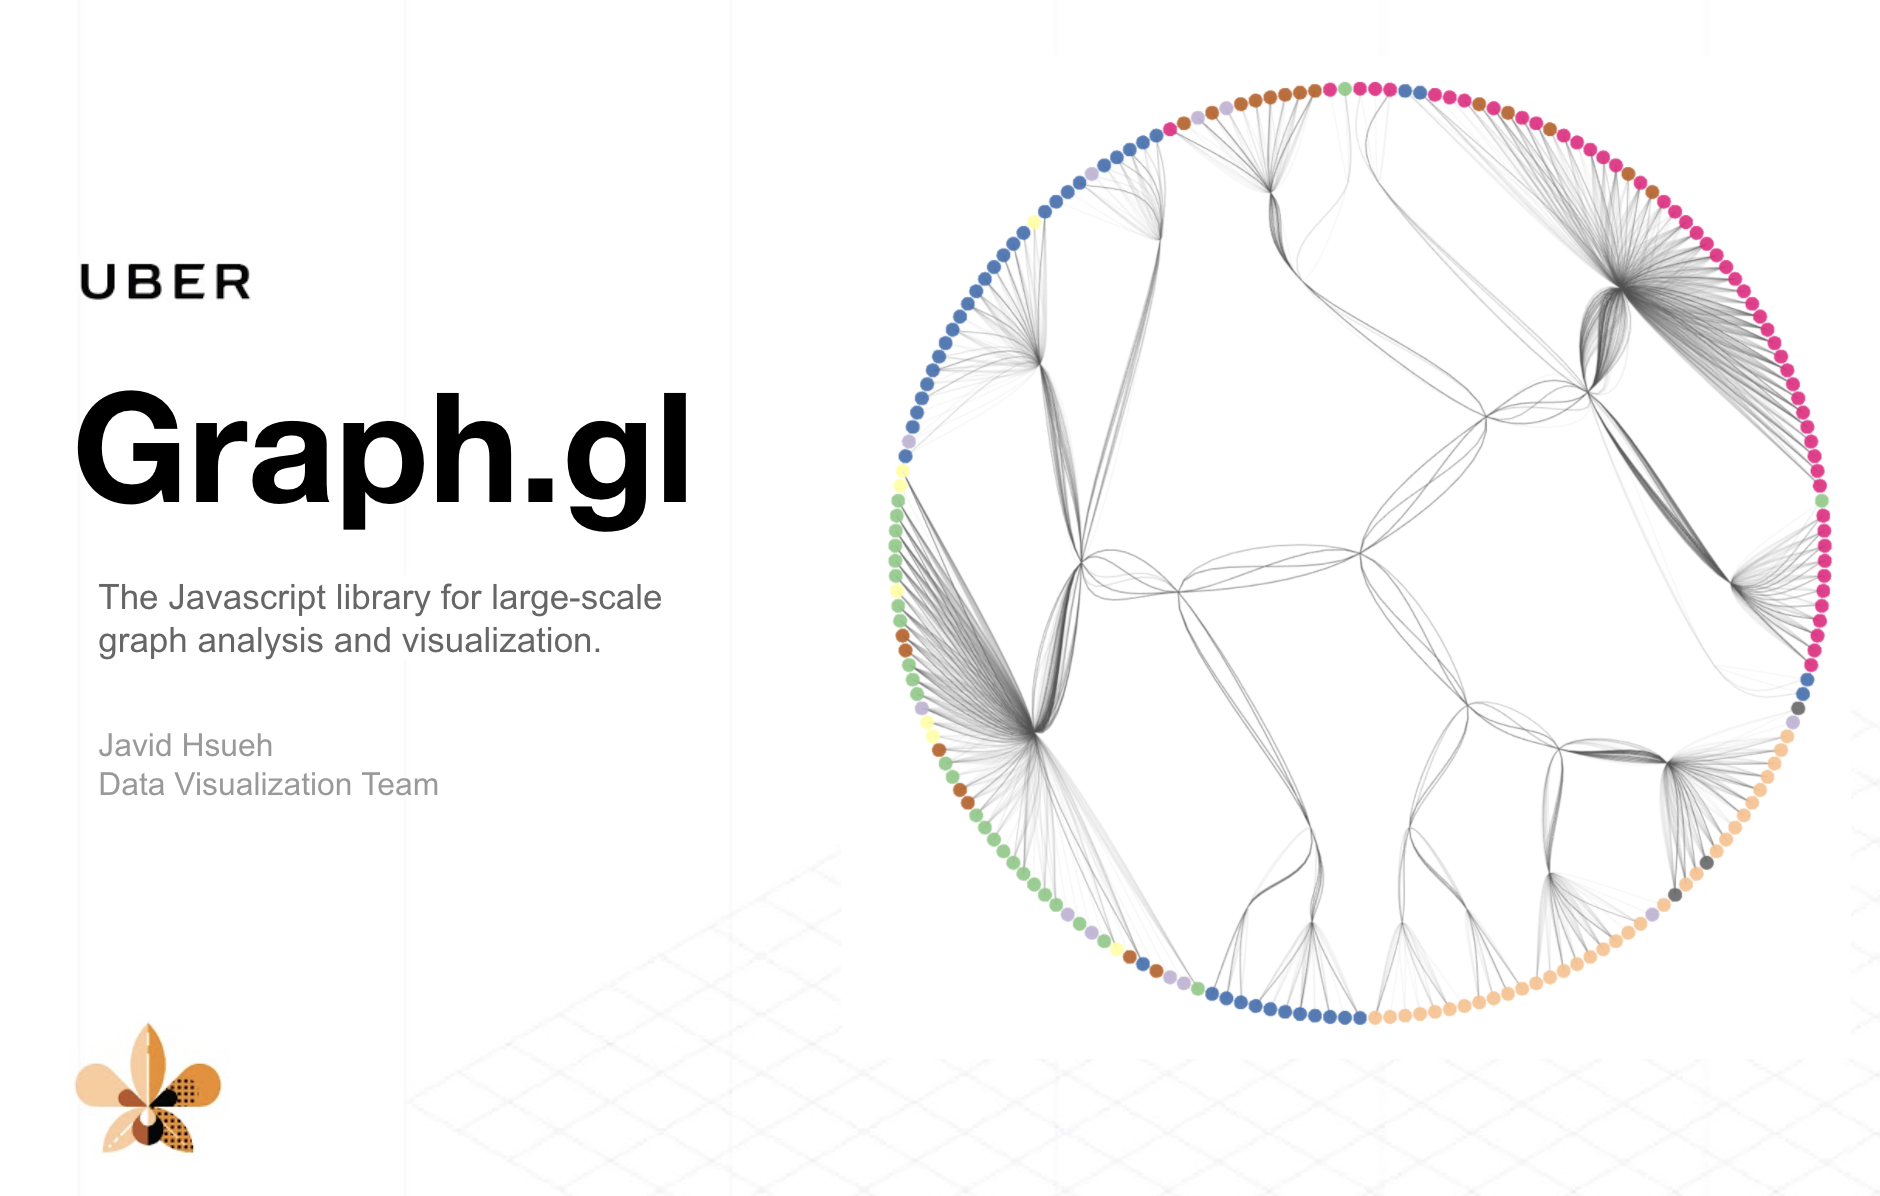
Graph.gl

Graph.gl

is a React component for visualizing large graphs with several utility functions. With Graph.gl, users are enabled to build various type of graph/network applications with minimum efforts while having the capability to extend the existing styles and layouts.

Explore all media 2 items
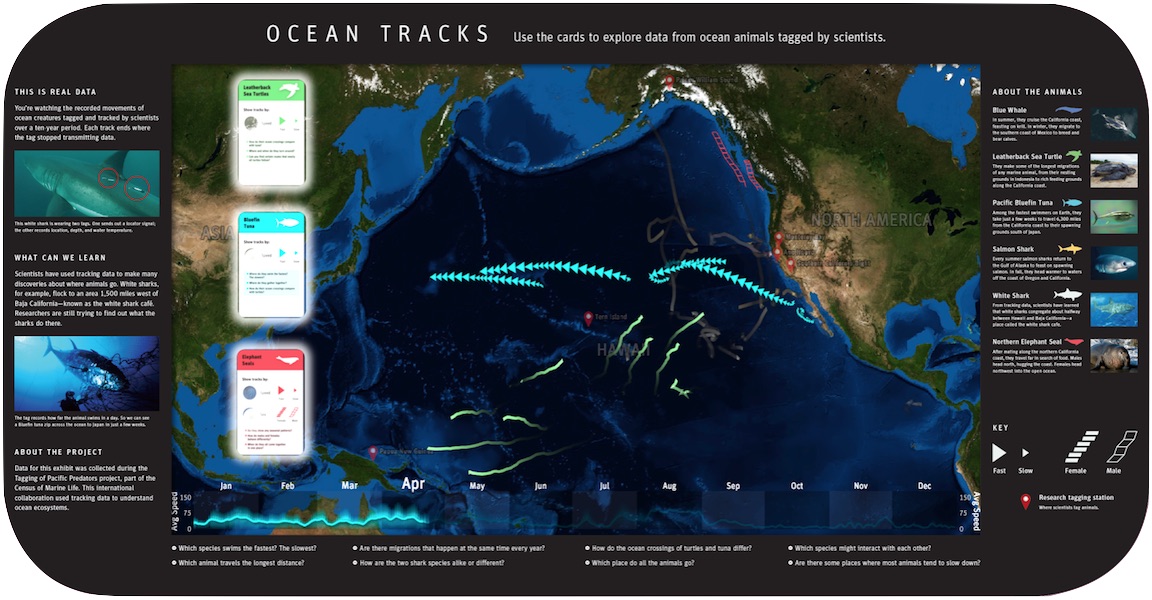
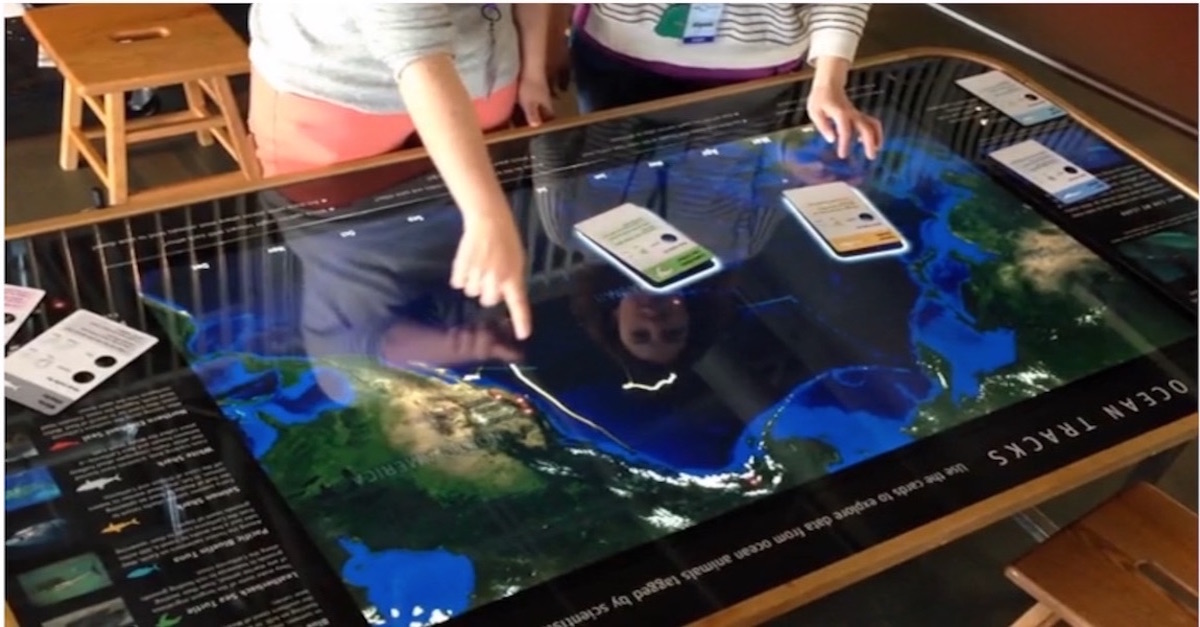
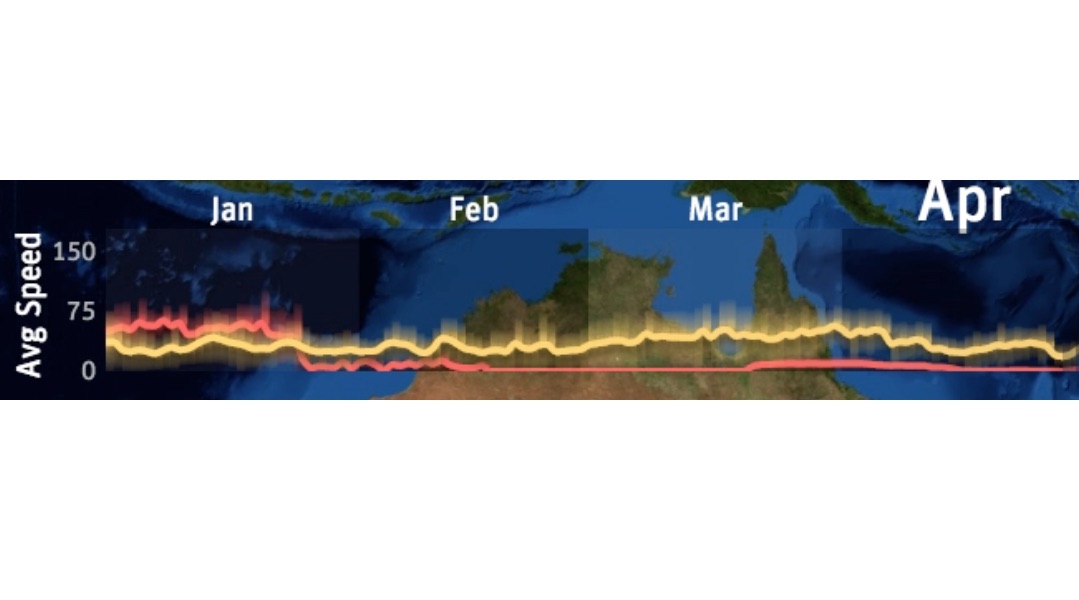
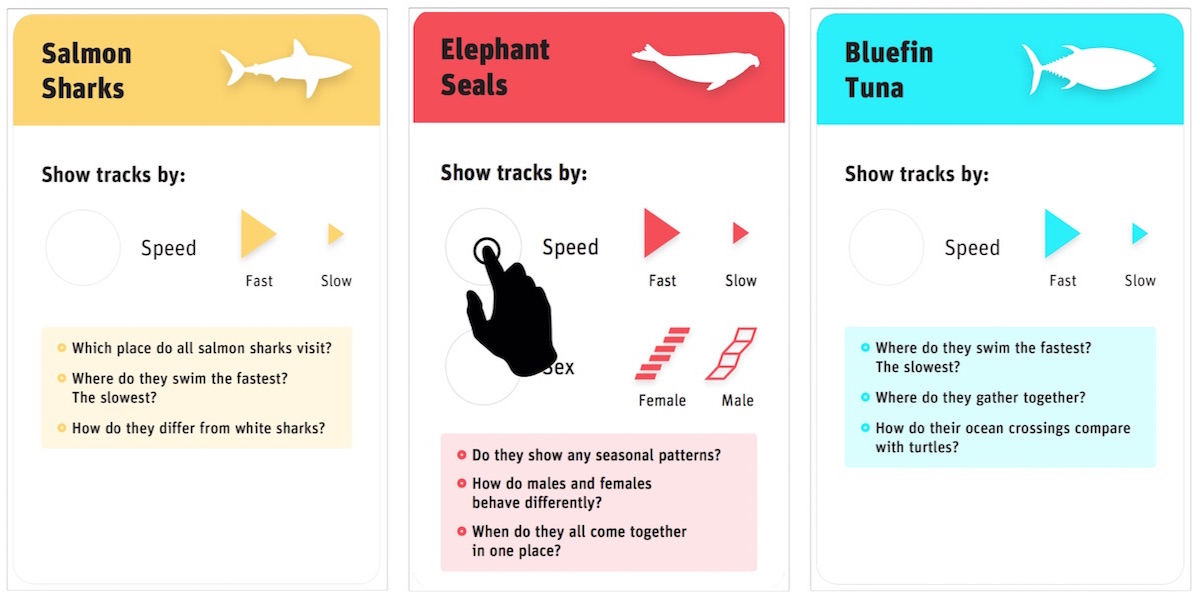
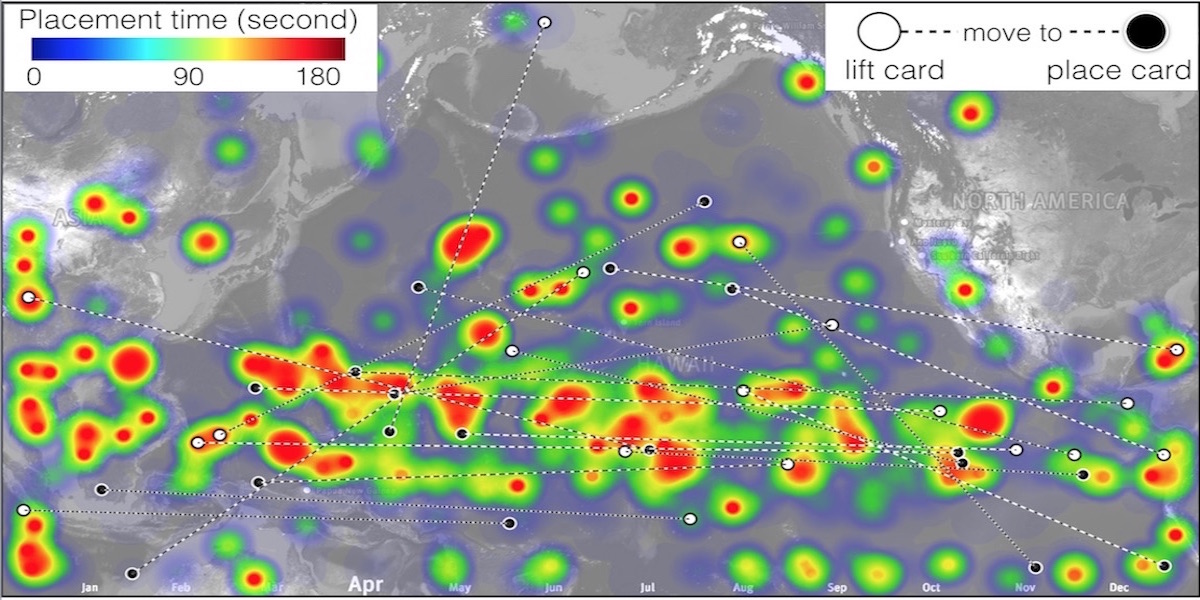
Fostering Comparisons: Designing an Interactive Exhibit that Visualizes Marine Animal BehaviorsWatch video ↗

Fostering Comparisons: Designing an Interactive Exhibit that Visualizes Marine Animal Behaviors

- a tangible multi-touch screen to be interacted with the users.

Watch video
Explore all media 7 items
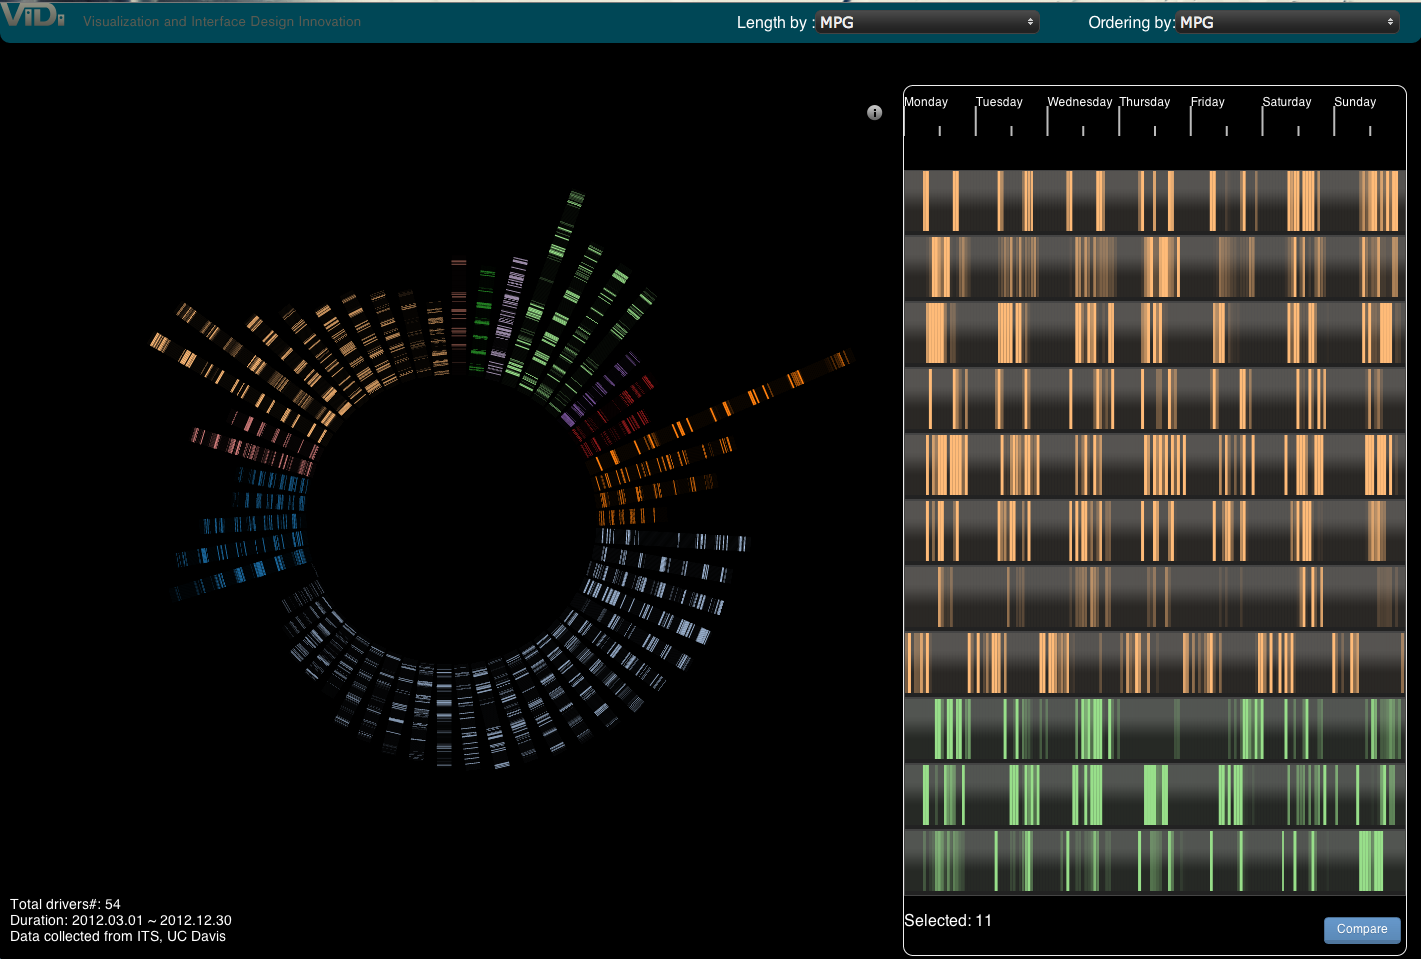
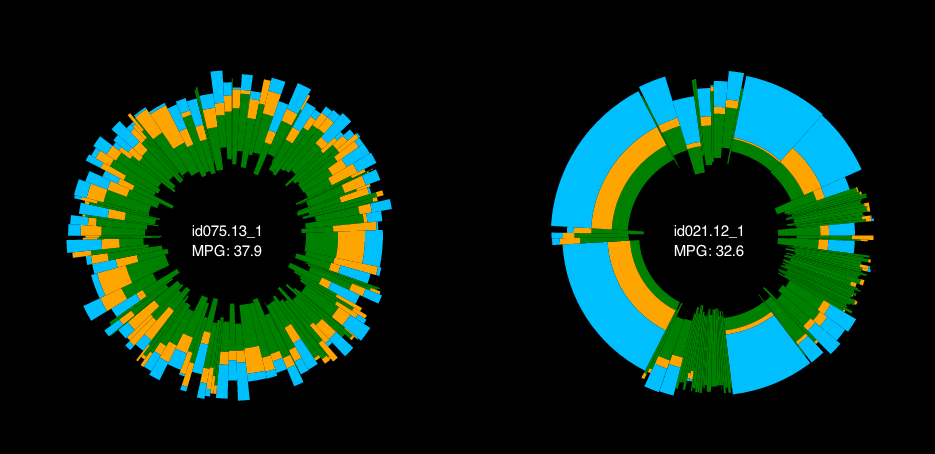
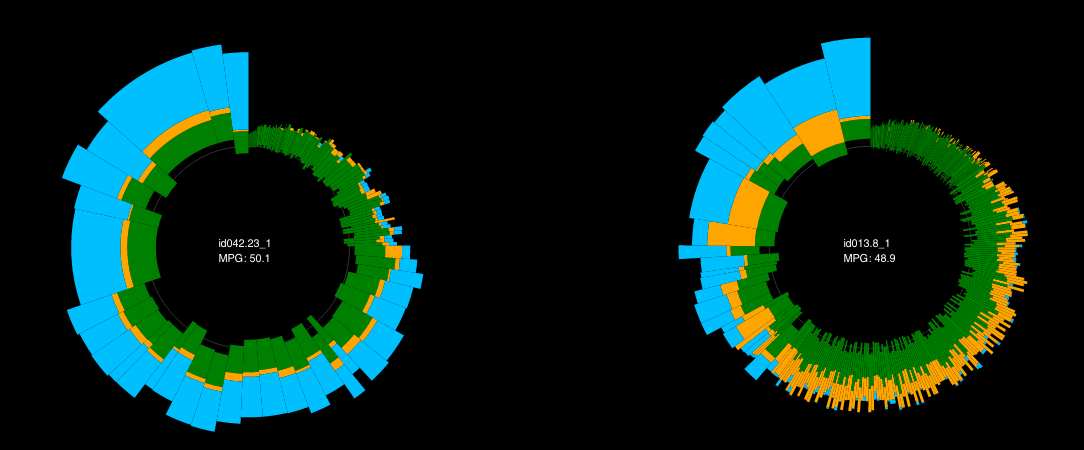
Driving BehaviorWatch video ↗

Driving Behavior

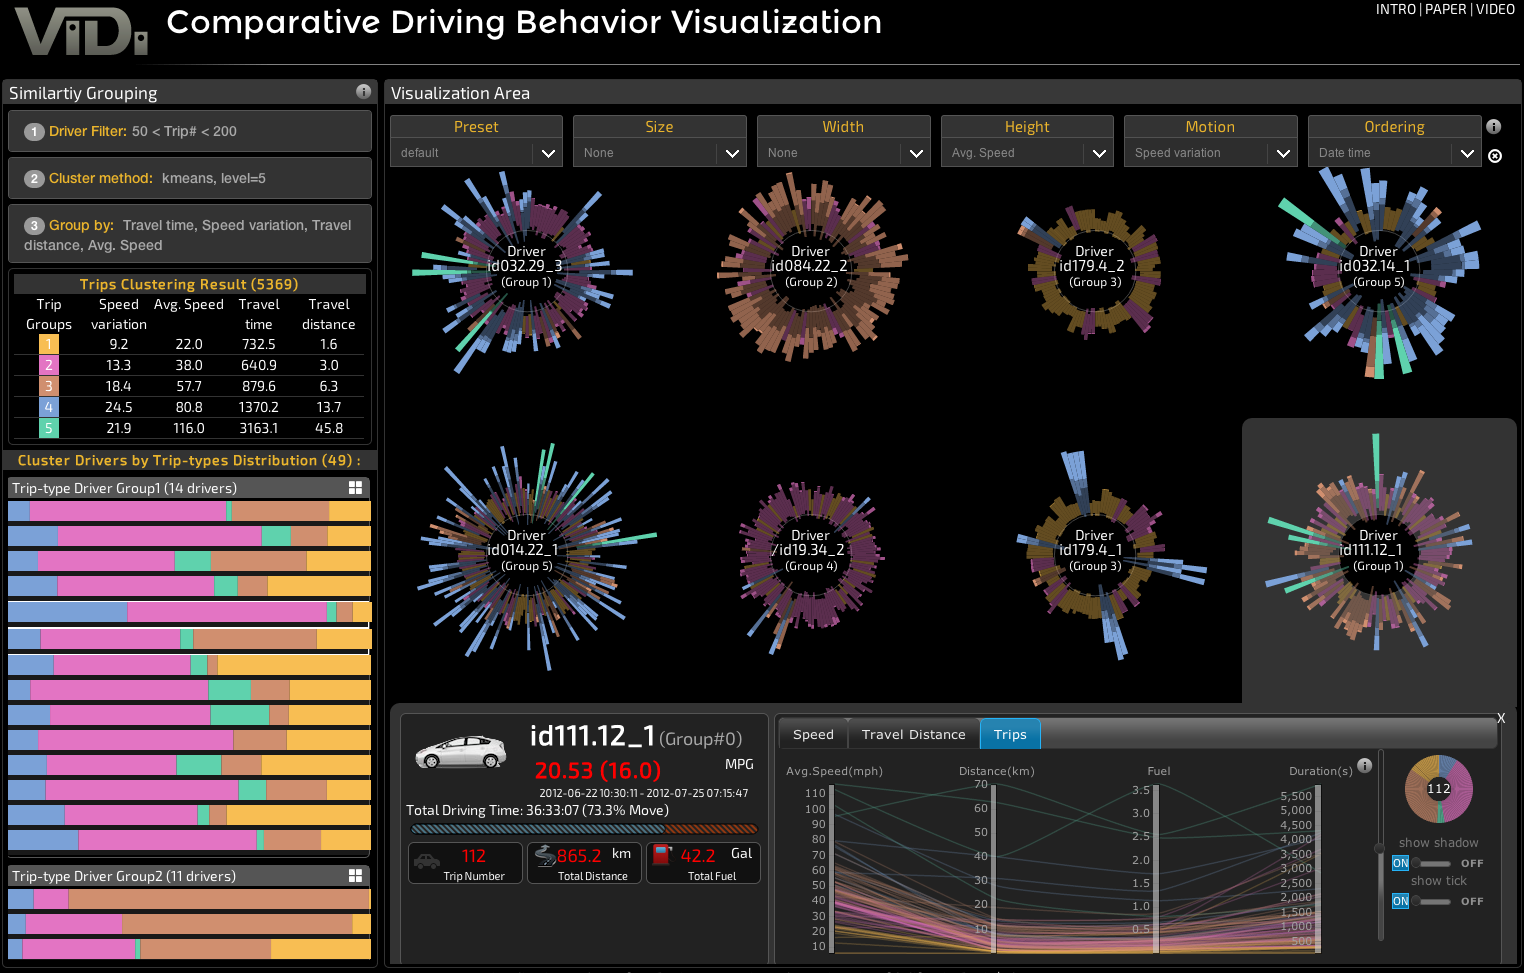
We have designed visualizations to represent driver behaviors. A series of user studies have been conducted to verify if adding motion to the static visualization can help users make comparisons and separate drastically different behaviors.

Watch video
Explore all media 5 items
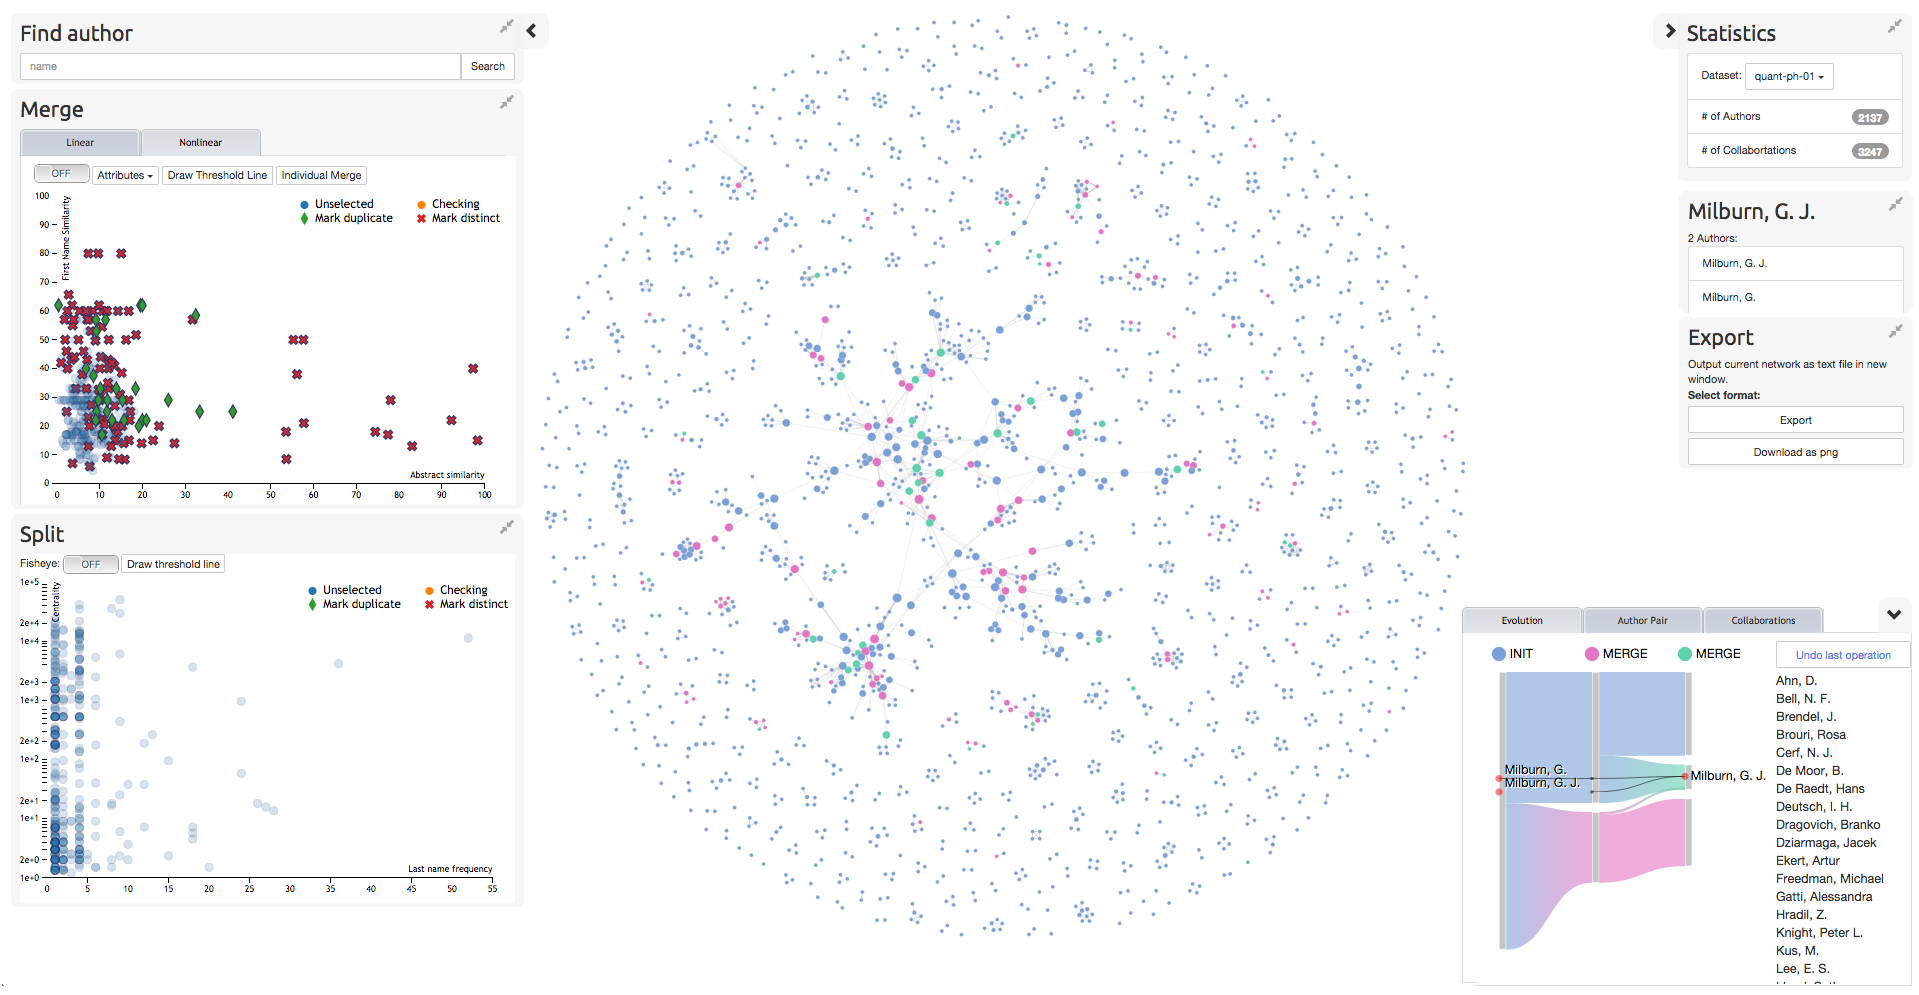
A Visual Approach for Name Disambiguation in Coauthorship NetworksWatch video ↗

A Visual Approach for Name Disambiguation in Coauthorship Networks

Watch video
Explore all media 2 items
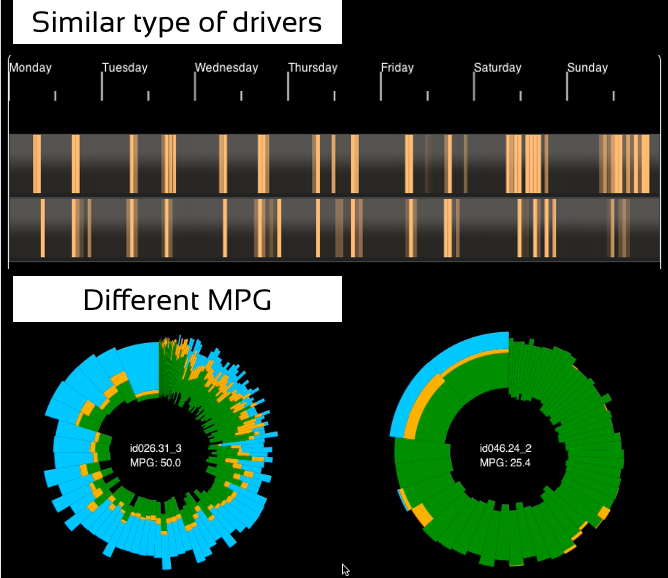
Comparative driving behavior visualizationWatch video ↗

Comparative driving behavior visualization

The goal of this project is to analyze driving behavior and visually compare them by using motion.

Watch video
Explore all media 2 items
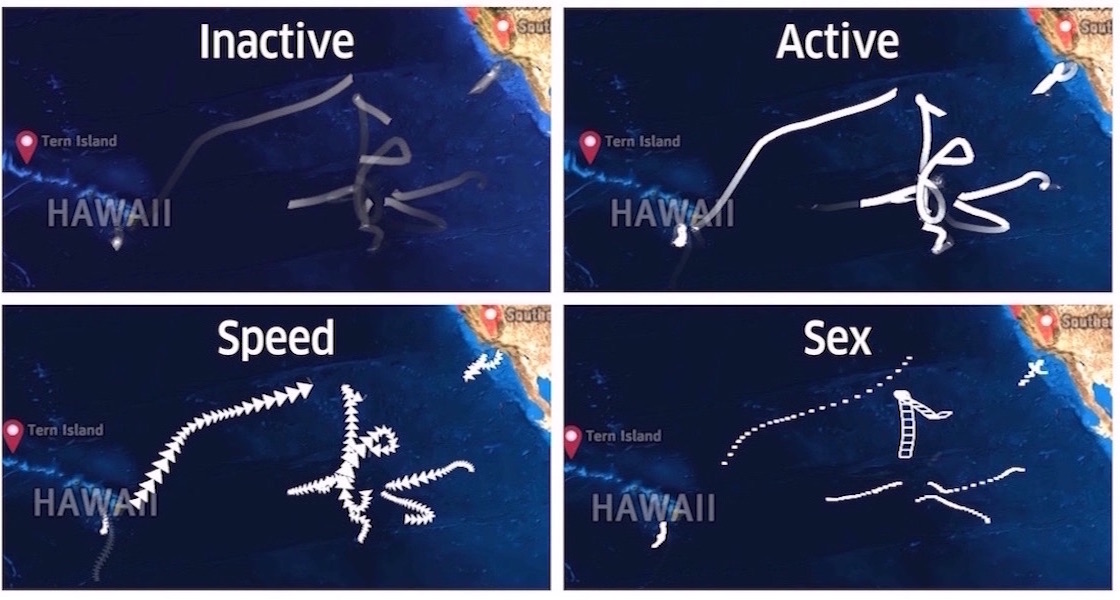
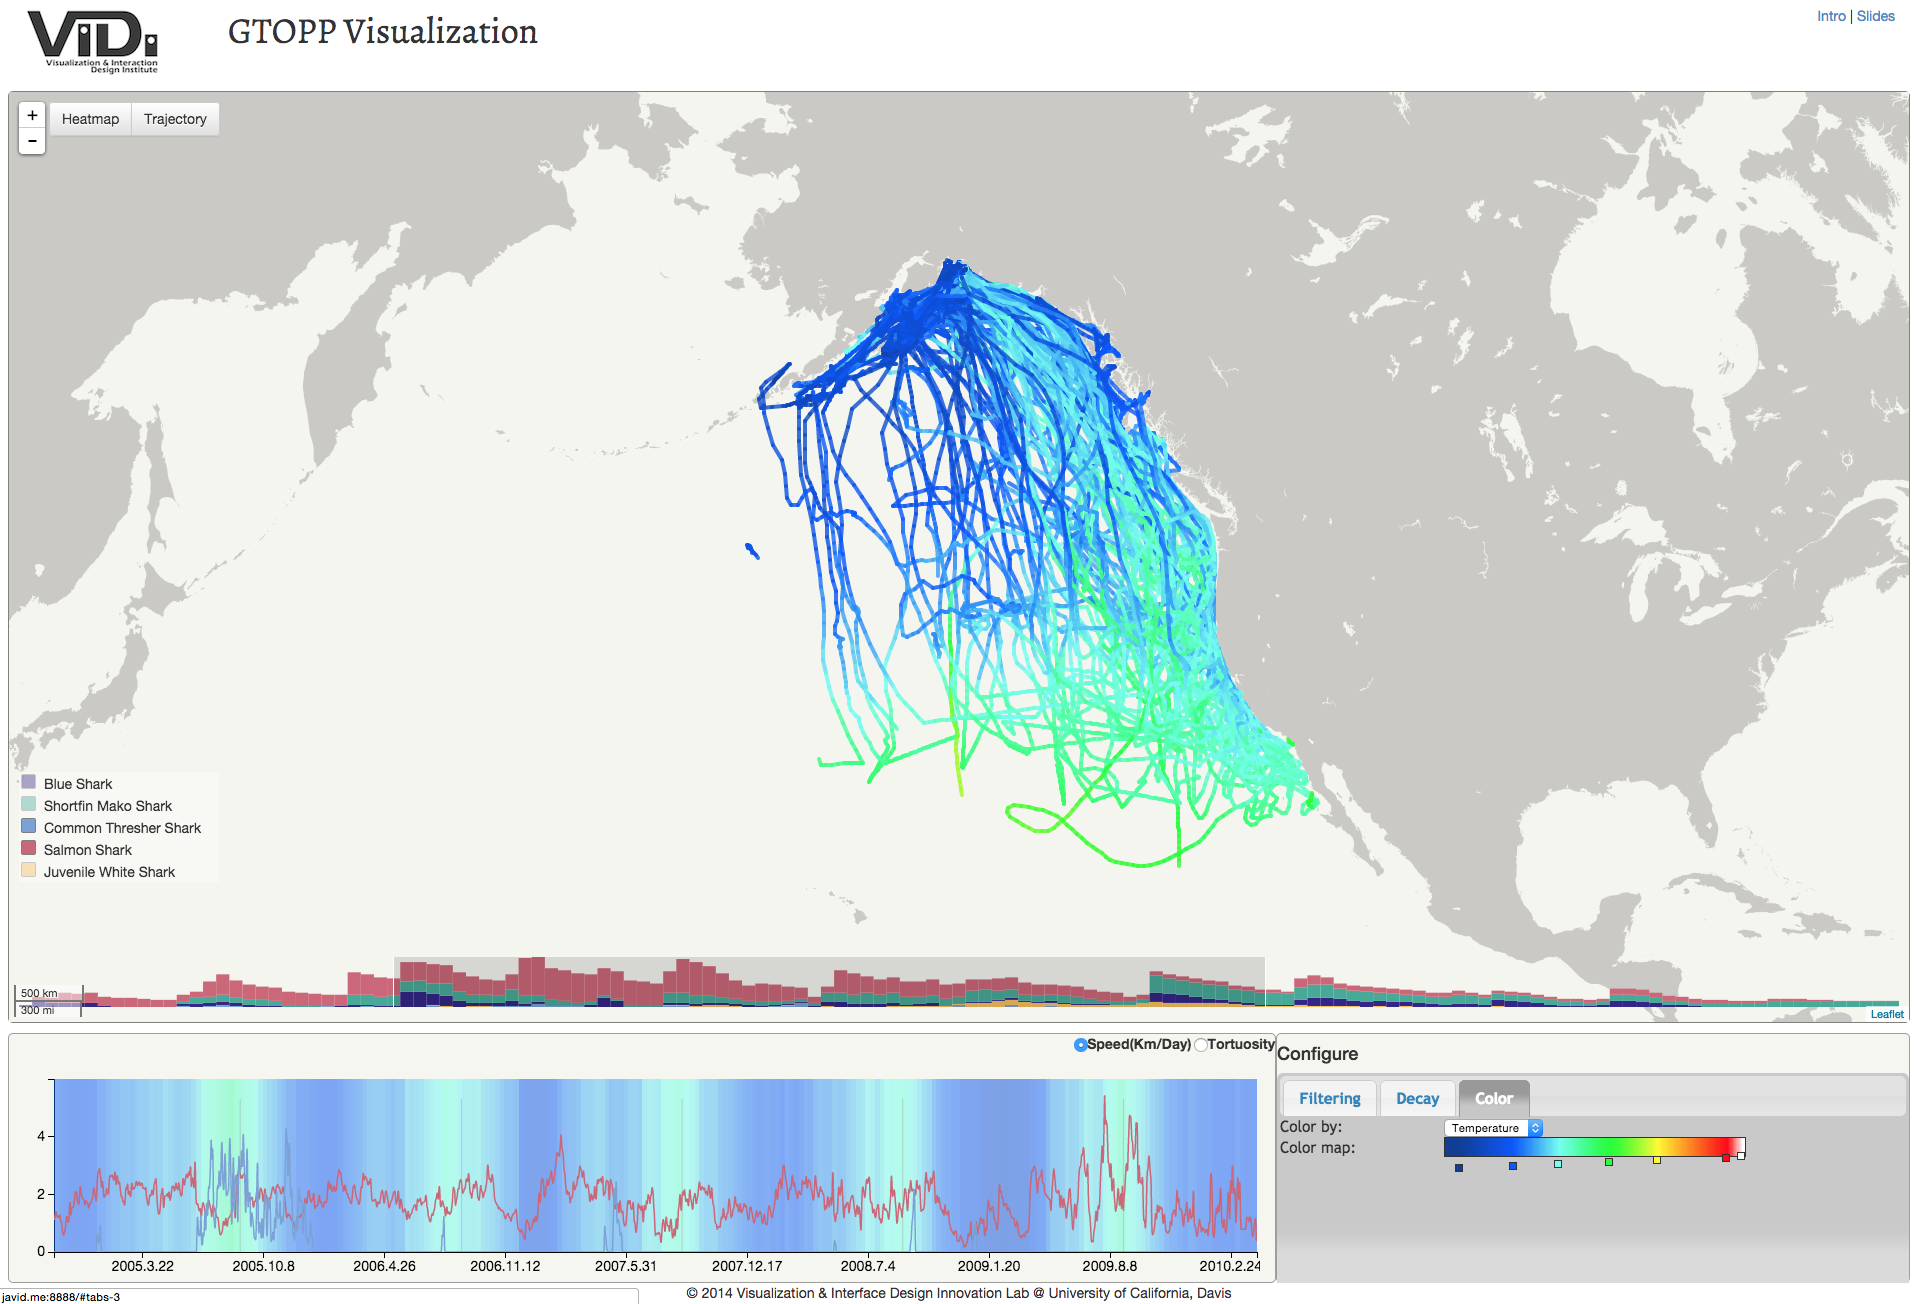
Marine animal migration visualization

Marine animal migration visualization

Explore all media 1 items
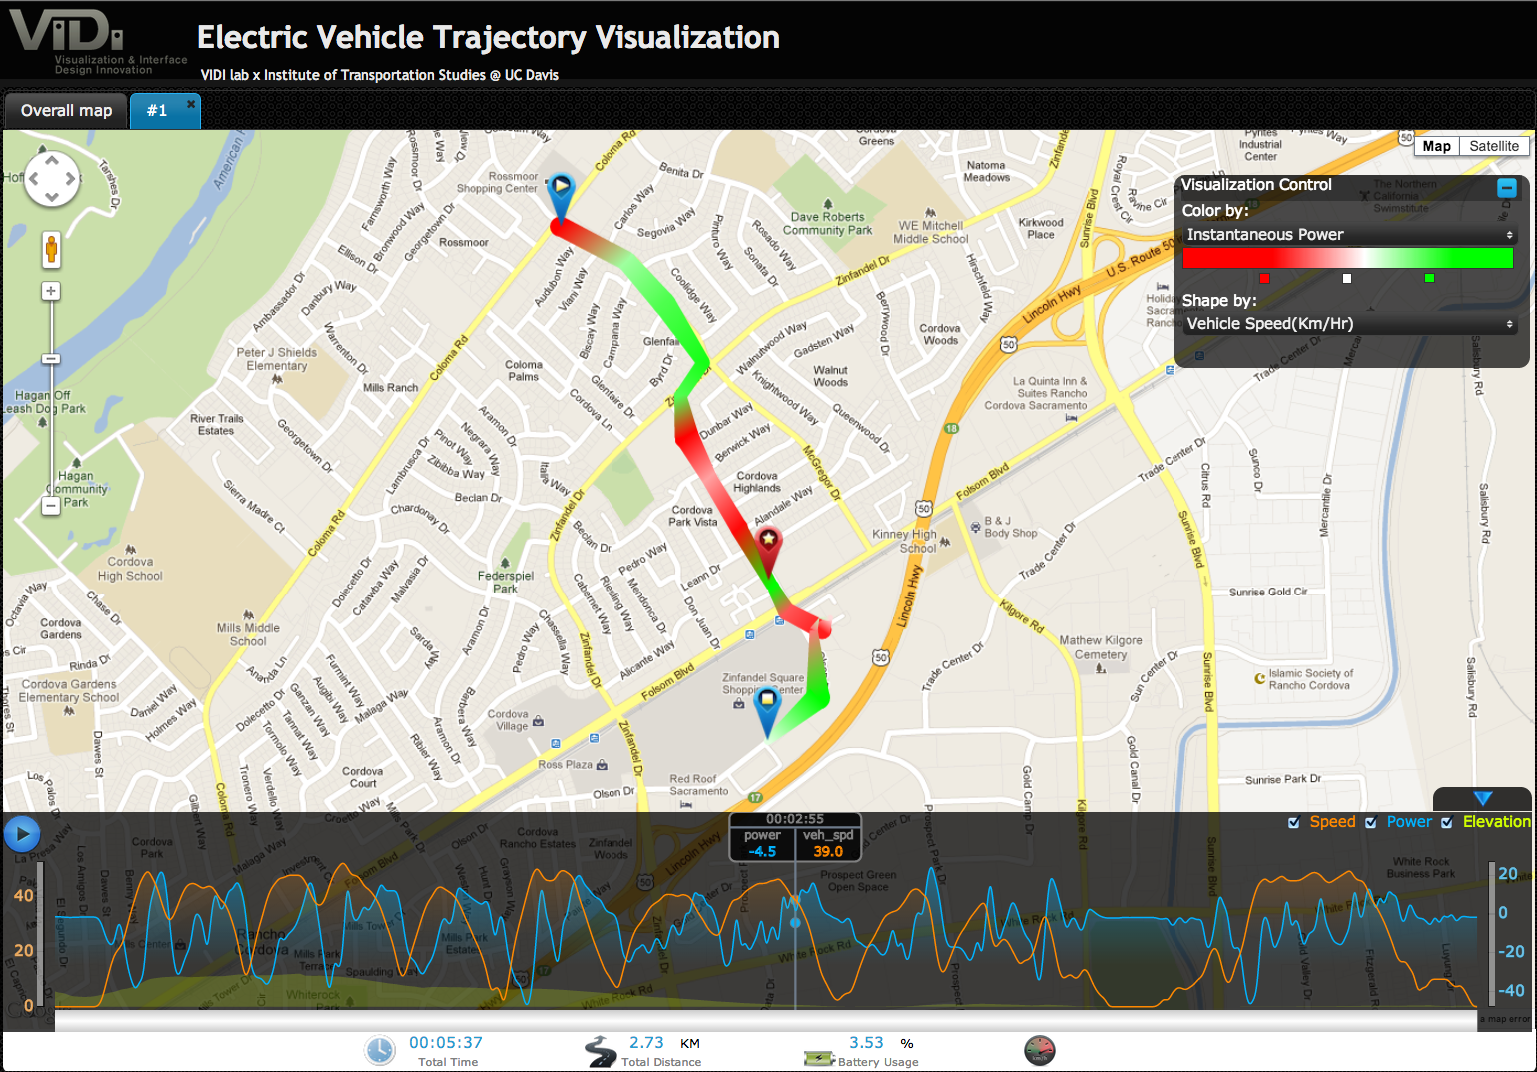
Interactive visualization of Electric Vehicle TrajectoryWatch video ↗

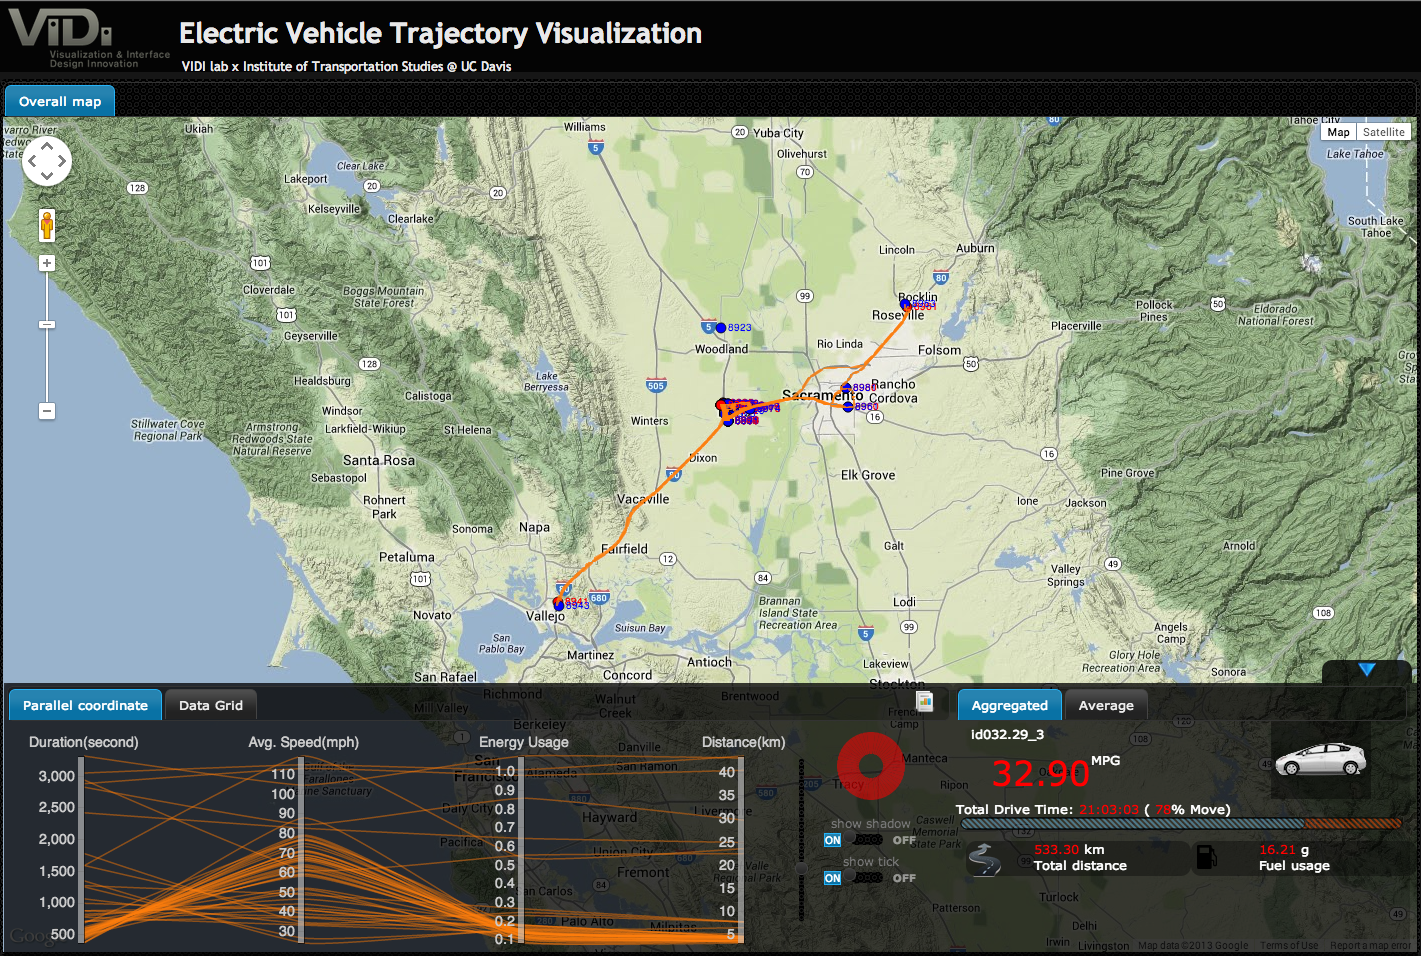
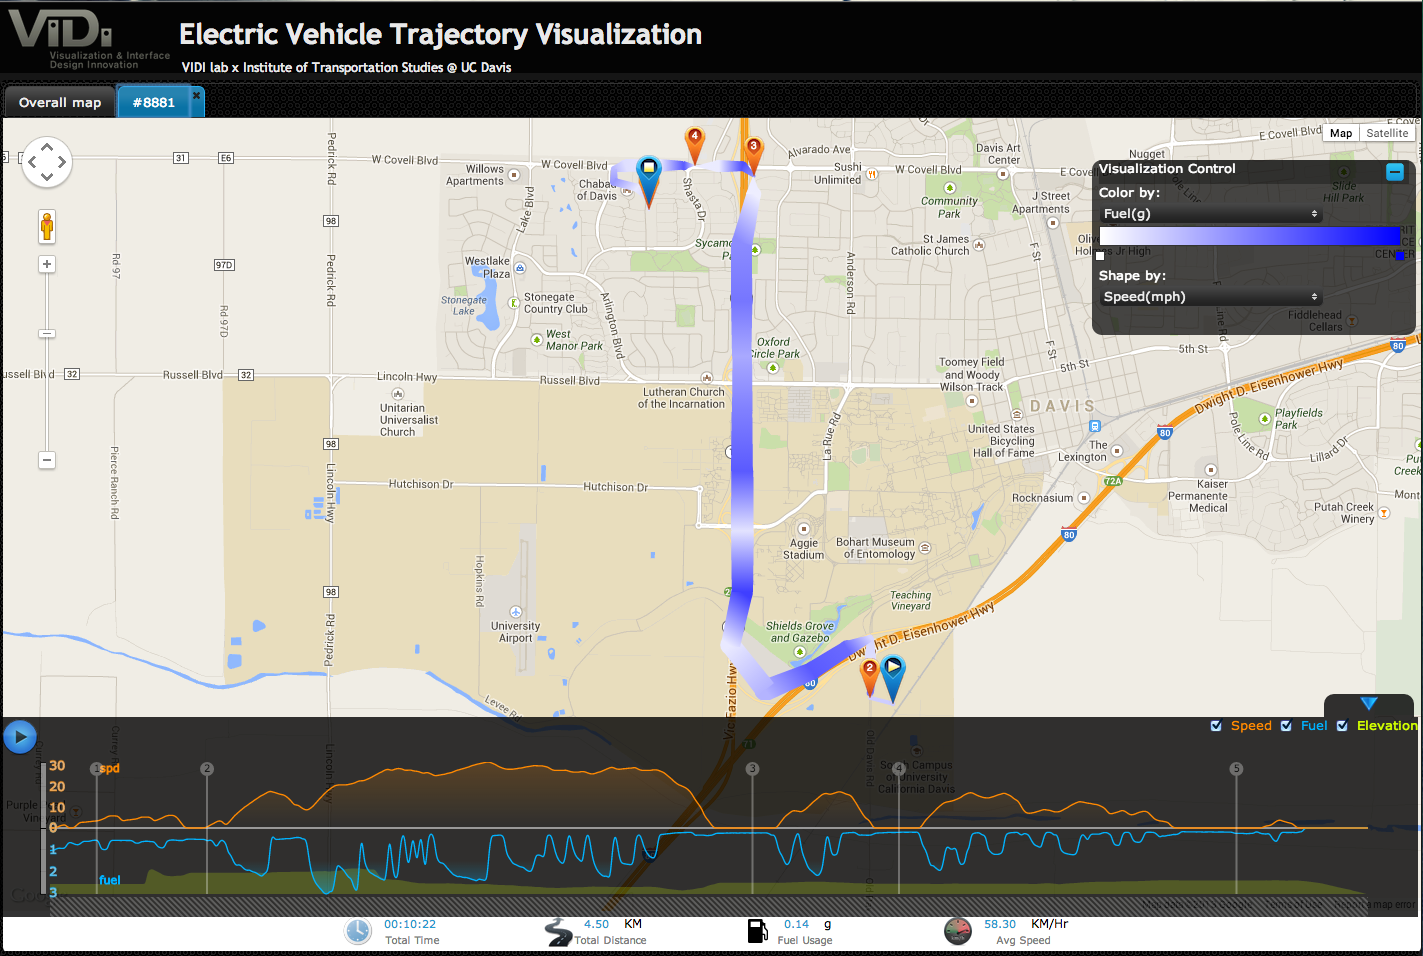
Interactive visualization of Electric Vehicle Trajectory

Watch video
Explore all media 4 items
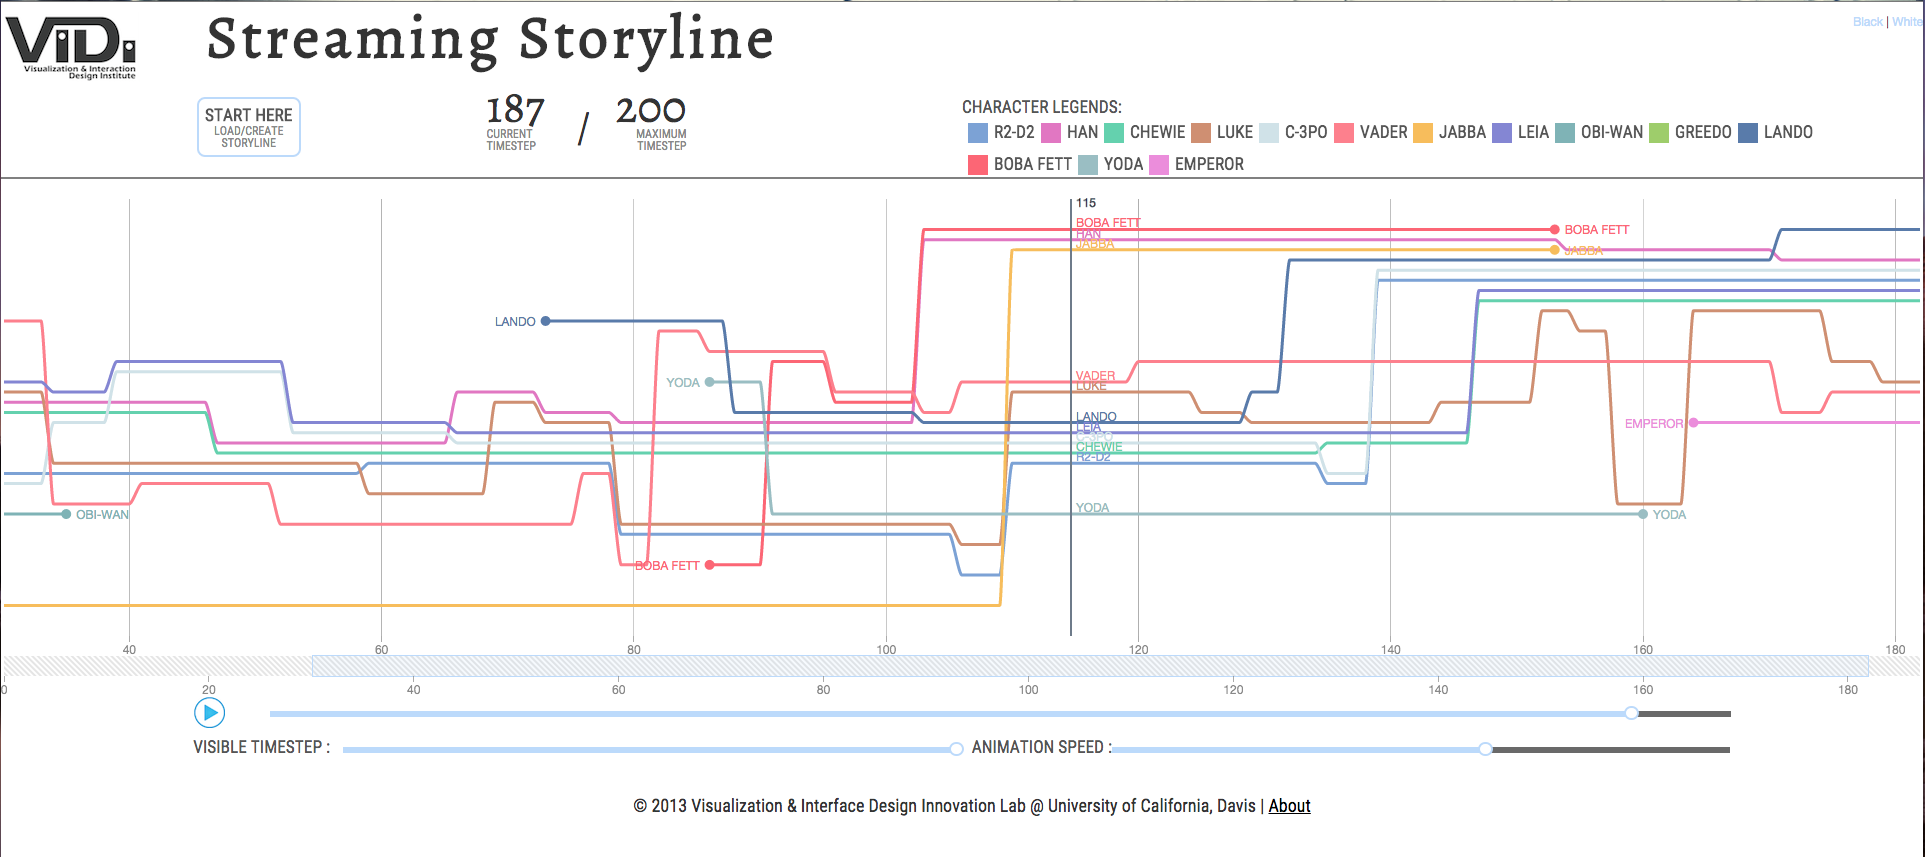
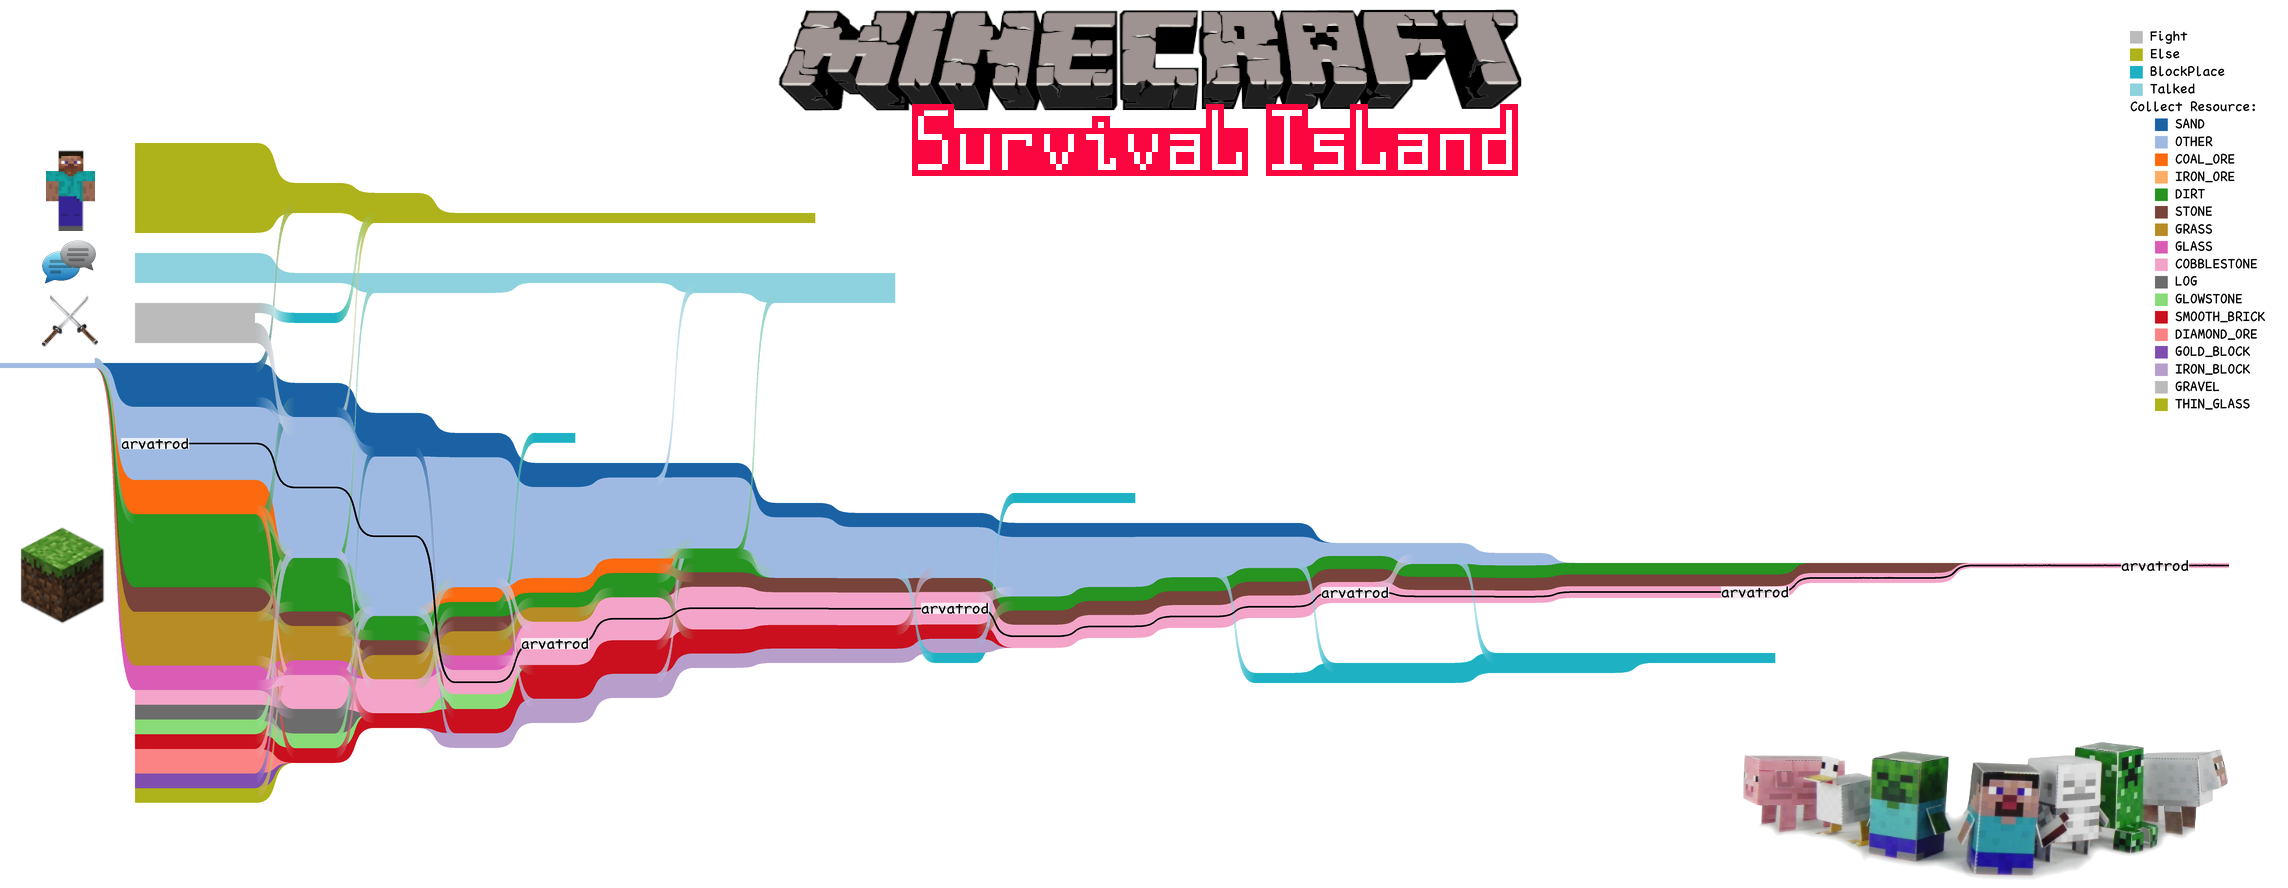
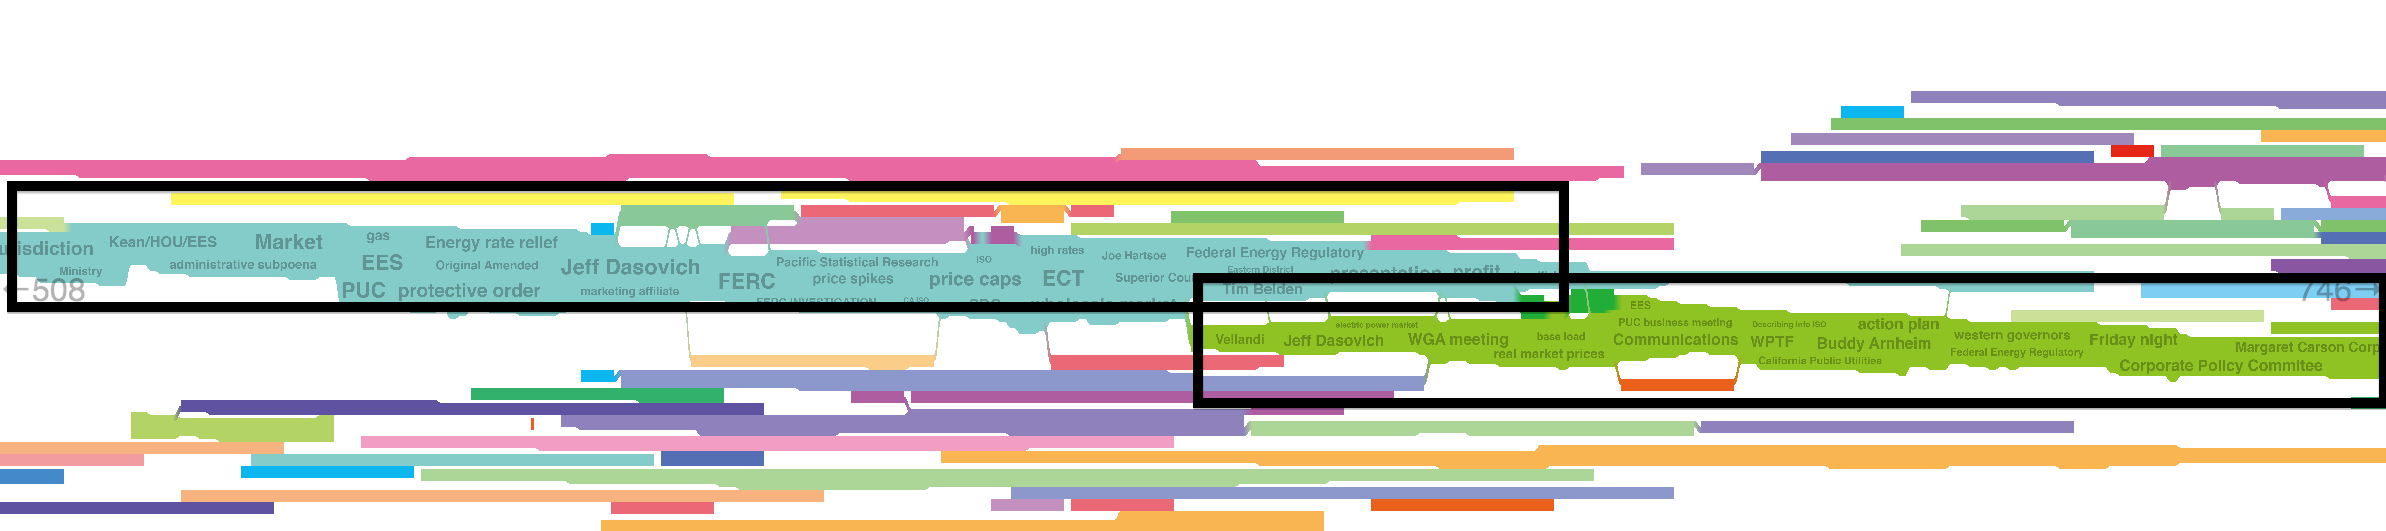
Storyline visualizationWatch video ↗

Storyline visualization

Watch video
Explore all media 4 items
Publications 5 papers
  • A Study of using Motion for Comparative Visualization.

    Chien-Hsin Hsueh, Jia-Kai Chou, Kwan-Liu Ma

    IEEE Pacific Visualization Symposium, 2015

  • Fostering Comparisons: Designing an Interactive Exhibit that Visualizes Marine Animal Behaviors.

    Chien-Hsin Hsueh, Jacqueline Chu, Kwan-Liu Ma, Joyce Ma, Jennifer Frazier

    IEEE Pacific Visualization Symposium, 2015

  • An Efficient Framework for Generating Storyline Visualizations from Streaming Data.

    Yuzuru Tanahashi, Chien-Hsin Hsueh, Kwan-Liu Ma

    IEEE Transaction on Visualization and Computer Graphics, 2015

  • Intrusive test automation with failed test case clustering. (Outstanding research award)

    Chien-Hsin Hsueh, Yung-Pin Cheng, Wei-Cheng Pan

    In Proceedings of APSEC‘2011, Ho Chi Minh, Vietnam

  • xDIVA: automatic animation between debugging break points.

    Yung-Pin Cheng, Han-Yi Tsai, Chih-Shun Wang, Chien-Hsin Hsueh

    Proceedings of SOFTVIS'2010. pp. 221~222, Utah, USA

Related demos & references
'Michelangelo' ↗Graph.gl ↗interactive visualization ↗TOPP ↗exhibit ↗Kwan-Liu Ma ↗VIDI ↗Driving Behavior Visualization ↗Interactive Visualization of Electric Vehicle Trajectory ↗Incremental Storyline Layout Algorithms for Streaming Data ↗Name disambiguation exploratory ↗

A little about me

Engineering with
a visual point of view.

I’m a Staff Software Engineer at Apple, working at the intersection of frontend engineering and data visualization.

I’m interested in how thoughtful interfaces help people explore information and make sense of complex systems.

My background includes visualization work at Uber and the Exploratorium, and a master’s in Computer Science from UC Davis.

Along the way

Frontend engineering and data visualization.

  1. Apple

    Staff Software Engineer

    Mar 2024–Present · Full-time

    AI/ML frontend engineer.

  2. Apple

    Senior Software Engineer

    Jun 2021–Feb 2024 · Full-time

    Data visualization engineer at special project group.

  3. Uber

    Senior Software Engineer

    Feb 2016–Jun 2021 · San Francisco Bay Area

    Led ML visualization for the next generation Michelangelo platform, prototyped A/B testing tools, and built knowledge graph visualization for Risk & Safety fraud investigation. Published Graph.gl and developed data exploration, charting, dashboards, and BI tools for operational and executive decisions.

    Data visualization lecturer at UC Davis Graduate School of Management.

Find me elsewhere.

A few ways to connect and follow along.